Back in 1999, the Environmental Protection Agency needed new approaches for understanding the complexities of U.S. coastal zones. NRRI’s proposal to do that work soared to the top of a very competitive heap. Of course, NRRI’s interest was in the Great Lakes coasts, not the Atlantic, Pacific, or even Gulf coast lines.The resulting laborious and unprecedented report delivered in 2015 – Great Lakes Environmental Indicators – served as a guide for comprehensive studies of those other well-known coastal zones and launched NRRI to national stature.
As one might expect, where huge bodies of water meet long, vibrant areas of land, it’s a complicated relationship. The freshwater coastal zones – stretching from Lake Superior’s North Shore in Minnesota to Lake Ontario in New York – are as complex as any. Each lake comes with its own challenges, each state with its own priorities and (except for Lake Michigan) ownership across two countries. And back in 1999, the lakes – especially the coastal zones – were largely understudied.
Complicating this even more, the EPA wanted ways of monitoring that could be generalized across the nation, from coast to coast to coast. This was not an average research request.
“When the Request for Proposals came out, I thought this is a dream,” said Jerry Niemi who, at the time, was NRRI’s Director of the Center for Water and the Environment. “I knew it was something we could do, but we had to go over-and-above to outcompete organizations that wouldn’t think as big. Seriously. That was our approach.” Today, Niemi is winding down his career with a joint position as NRRI Senior Research Associate and UMD Biology Professor.
To tackle the proposal, Niemi pulled together NRRI’s broad scientific expertise of ecologists, biologists and limnologists. Then they searched their network of esteemed scientists within the University of Minnesota and across the Great Lakes. The Great Lakes Environmental Indicators (GLEI) project was born.
The resulting proposal was, in the words of EPA’s Michael McDonald, “amazing conceptualization and one of the few proposals I’ve seen that got excellent reviews.” Today, McDonald is the EPA’s Branch Chief for Ecological and Human Community Analysis in North Carolina. “NRRI took a new approach to looking at sub-basins and the land that fed into the streams. A lot of intense thinking went into their proposal from a lot of different disciplines,” he added.
In 2000, NRRI received the $6 million grant – at that time the largest ever received at UMD – and everyone was bit nervous. Could they really pull this off? The key would be collaboration, tight coordination and a way to collect data across all watersheds. Principal investigators were assigned to five different indicator groups: 1) Diatoms and Water Quality, 2) Fish and Macro-invertebrates, 3) Wetland Vegetation, 4) Birds and Amphibians, and 5) Chemical Contaminants. [See list below of collaborating institutions.]
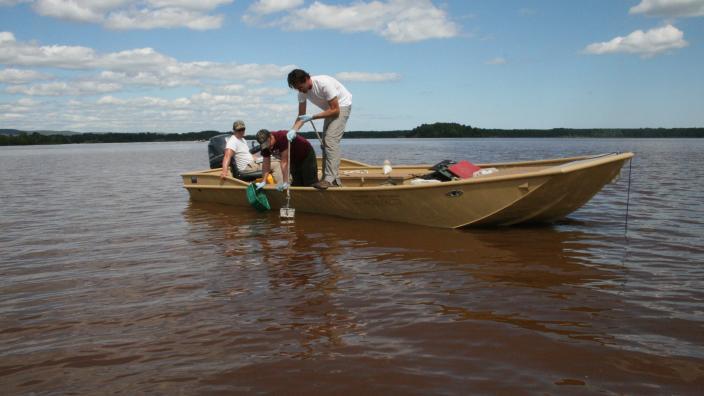
NRRI’s Geographic Information Systems Lab got busy developing the extensive sampling protocol and field work began. Reams of data were collected in the U.S. Great Lakes basin and over 50 peer-reviewed articles and reports were completed. But the funding was terminated five years early, before all the data could be fully analyzed. Fortunately in 2010, NRRI received an additional $1.7 million through the Great Lakes Restoration Initiative for GLEI 2.
“We went back to GLEI 1, and developed different analyses to identify how different plants and animals respond to different human pressures on them,” explained Lucinda Johnson, principal investigator on GLEI 2. “It’s complicated, but at least we can see which species behave similarly.”
More field data were collected, this time in Canada, too, but the primary goal of this second go-round was to bring all of the pieces of the project together into a coherent set of tools and products. Now both countries have the indicators they need to monitor and assess their required environmental obligations as outlined in the 1972 Great Lakes Water Quality Agreement (revised in 2012).
“Monitoring is important because it gives us the baseline for how the environment is changing,” explained McDonald. “It also provides a rationale for where the biggest problems are and what we need to do to solve them. I’ve seen these tools in action to define new approaches to solving problems.”
It took 15 years, but as 2015 came to a close the GLEI team submitted a 239-page report to the EPA describing its findings. Among the terabytes of data collected, close to 100 peer-reviewed papers, countless metrics and methodologies, three tools emerged that provide the capacity to both postulate and confirm the condition of the entire Great Lakes shoreline. [See sidebar for information about the three tools.] Overall, they found that birds, plants and fish tend to be the most consistent indicators of environmental change. Invertebrates (aquatic bugs) tend to be generalists, and diatoms are most useful as indicators of long-term changes.
“And for the first time, there are measurements that are specifically designed to identify the condition of non-wetland ecosystems, shorelines with a lot of wave action,” explained Johnson. “They’re challenging because there’s not a lot of habitat diversity and you need a nice, calm day just to get out there.”
The goal of identifying the most efficient, economical and effective biological indicators was met with a collective sigh of relief for this massive effort.
“I’m a believer in go big, or go home,” said McDonald. “That’s where NRRI and this project hit a homerun. I don’t know if people appreciate how much GLEI advanced the science within federal and state agencies.”
GLEI Collaborators
- Minnesota Sea Grant
- University of Minnesota Duluth Department of Mathematics
- University of Wisconsin, Green Bay
- University of Wisconsin, Madison
- Cornell University, Ithaca, New York
- University of Michigan, Ann Arbor, Michigan
- University of Windsor, Ontario
- John Carroll University, Cleveland, Ohio
- University of Minnesota, St. Paul, Minnesota
- U.S. EPA Mid-Continent Ecology Division in Duluth and Grosse Ile, Michigan
GLEI Tools for Environmental Monitoring
- Index of Ecological Condition: A method for generating the biological condition of a site using birds and frogs as indicators. An integrated index has also been developed to combine different groups of organisms such as birds, fish, and invertebrates as a multi-species indicator. This allows easier interpretation for the user because it requires less information to examine and synthesize.
- Weighted Average: Similar to the Index of Ecological Condition, the Weighted Average is useful for indicator development with diatoms in changing environmental conditions. It can also be used for archived data from sediment cores to provide a good historic record or for setting restoration or protection targets.
- Biological Benchmarks: Human impact (stress) thresholds are established with benchmarks such as loss of sensitive species or increased dominance by tolerant indicator species. These stress-thresholds provide useful information for environmental decision-makers.